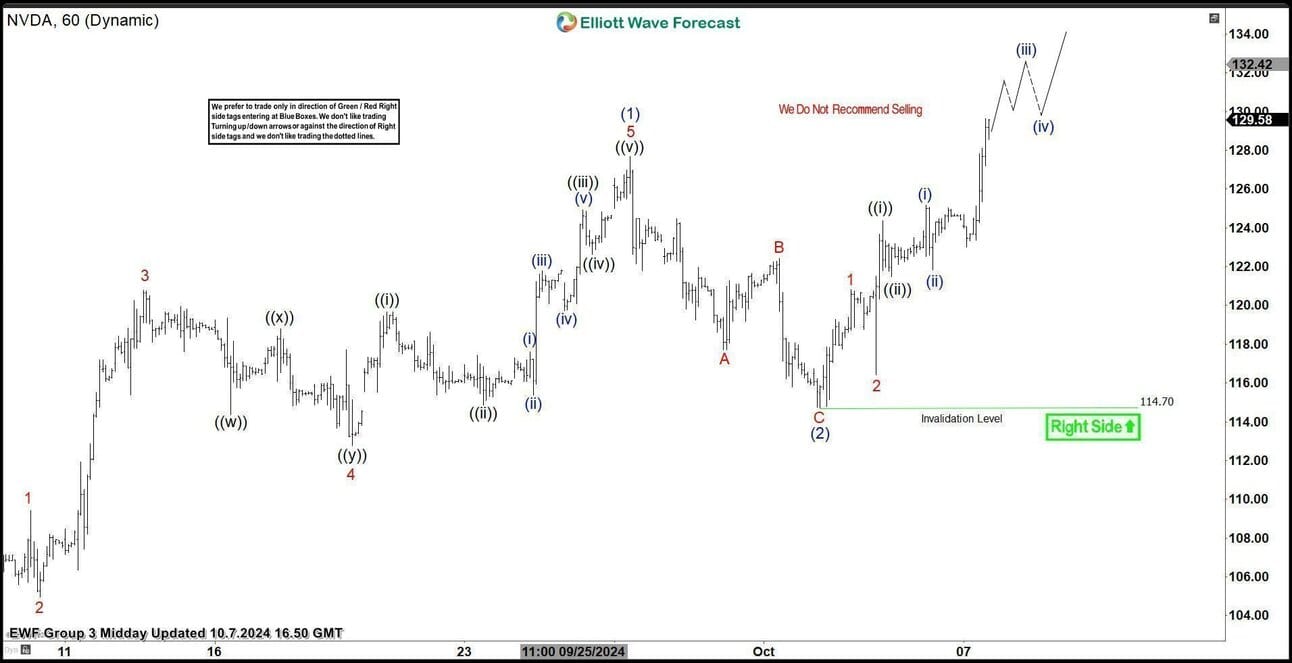
Elliott Wave Forecast has posted a nice wave count for Nvida. The chart uses 60-minute bars and proposes that we are currently in the 1st wave of a potential 5-wave impulse sequence.
The follows the completion of a 4th wave move at around the 128 level.
Here’s the chart…
Let’s look at first waves and how they can be useful…
In the Elliott wave model, first waves are the first upward impulse wave that emerges after a corrective phase (in this case, following a 4th wave correction).
Remember, a full Elliott wave sequence consists of 5 impulse waves (waves 1, 3, and 5 move in the direction of the trend, while waves 2 and 4 are corrections within that trend) and 3 corrective waves (A-B-C). Also remember that impulse waves – 1, 3 and 5 – trace out five waves on a smaller scale. That’s how the chart shows NVDA in wave 1 of wave (5).
The red arrow shows the current position of Nvida – according to Elliott Wave Forecast -- on an Elliott wave map.

The 1st wave is a pivotal moment for Elliott wave traders because it marks the end of a correction and the beginning of a new bullish trend. For that reason, it’s often accompanied by caution and skepticism as traders still doubt that the corrective phase is over. During the first wave, market sentiment might still be bearish or neutral.
First waves are not normally as explosive or volatile as third waves, again the move reflects caution.
Here’s what Prechter and Frost, wrote about first waves in Elliott Wave Principle: Key to Market Behavior:
“First waves, following a correction, are rarely recognized at their inception. They are generally a modest advance, and at this stage, market sentiment is often still bearish or disinterested."
This quote perfectly captures the uncertain nature of the 1st wave. Even though it represents the start of a new impulsive trend, it can often be overlooked because market participants are still influenced by the correction that preceded it.
Here’s what Elliott wave traders are thinking about during a first wave…
A trader is primarily trying to determine whether this is, indeed, wave 1 and the start of a new bullish trend. They look for confirmation by assessing the wave’s structure, price action, and volume to confirm if a 5-wave impulsive sequence is beginning.
Once Wave 1 completes, they expect a corrective Wave 2 to follow. If the retracement of Wave 2 is shallow and within common levels, it will increase confidence that Wave 1 was indeed the start of a new impulse. The most important levels to watch during the pullback of Wave 2 are the 50% and 61.8% Fibonacci retracement levels of Wave 1.
A deep retracement or breaking below key levels could invalidate the count. The most critical level is the origin of Wave 1 itself. If Wave 2 retraces more than 100% of Wave 1, the entire Elliott wave count is invalidated. In the Nvida chart, that level is around 128, where wave (4) ends and 1 of (5) starts.
Follow Elliott Wave Forecast to get more charts like this. Sign up for The Elliott Wave Pattern to get emailed lessons like this, using the world’s top analysis covering the most compelling Elliott wave counts.

